Code profilers have considerable value in identifying performance issues by offering developers a systematic and relatively cheap way of profiling data about an application’s performance, specifically in production. This allows developers to investigate issues at the code level, where they can then optimize and resolve performance issues, reduce costs, enhance the user experience, and improve the application’s scalability.
In a nutshell, code profilers facilitate finding the root causes of performance problems and provide actionable insights for fixing them.
In a previous blog post, we provided an introduction to continuous profiling. Now, after a brief review, we will discuss how to use profiling data (i.e., flame graphs) to find opportunities for performance optimization and lower infrastructure costs. Plus, we’ll introduce our own profiling tool.
Code-Level Performance Analysis
Overview of Flame Graphs
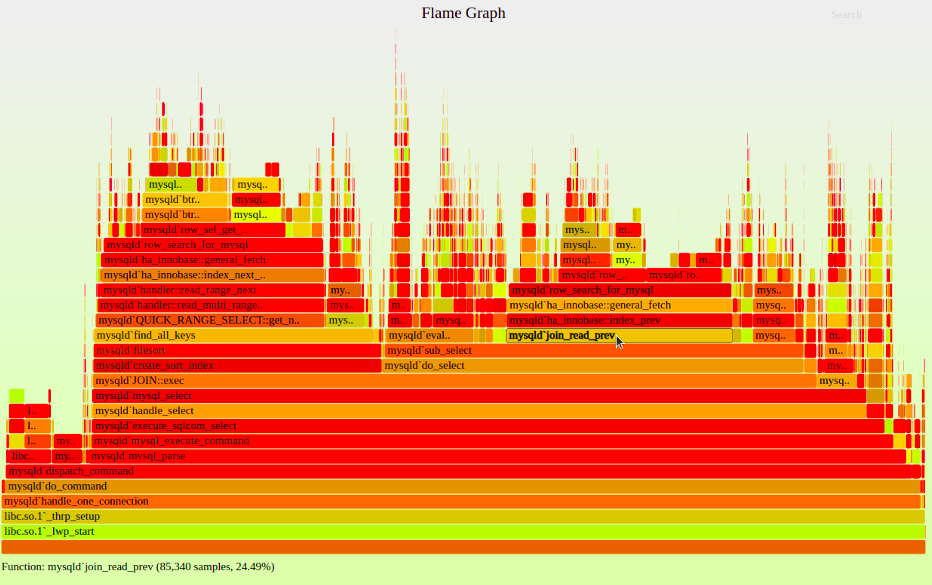
Figure 1: CPU Flame Graph (Source: BrendanGregg.com)
Most code profiling tools implement flame graphs, a powerful utility for visualizing and analyzing performance using profiling data. A flame graph is generated by continuously sampling, for example, CPU, analyzing which stack trace is being executed, and building a cumulative graph per a given profiling type (here, how much time/resources each stack and frame took). The following figure shows a CPU flame graph, representing the highest CPU usage of the sampled functions:
Each function is represented as a rectangle (frame), ordered vertically from top to bottom (y-axis) based on the call stack hierarchy. The primary indication of a frame is its width since this indicates resource usage, which in turn helps you identify the code functions consuming the most CPU. On the x-axis (horizontally), functions are arranged not based on the time of execution but alphabetically. Here are the main points to consider when analyzing flame graphs:
- Y-axis: This represents the depth of the nested functions’ hierarchy.
- X-axis: The wider a function on the x-axis, the more time-intensive it will be (since it represents the execution time spent by a function in relation to its parent function’s total time).
- Graph colors do not contribute to performance analysis; they are used only to correlate methods to their packages.
Using Flame Graphs to Identify Resource-Intensive Code Paths
Flame graphs help developers discover resources that might behave poorly by looking for functions taking up more of the total runtime than expected. Most importantly, a flame graph is a great tool to identify hot code paths quickly.
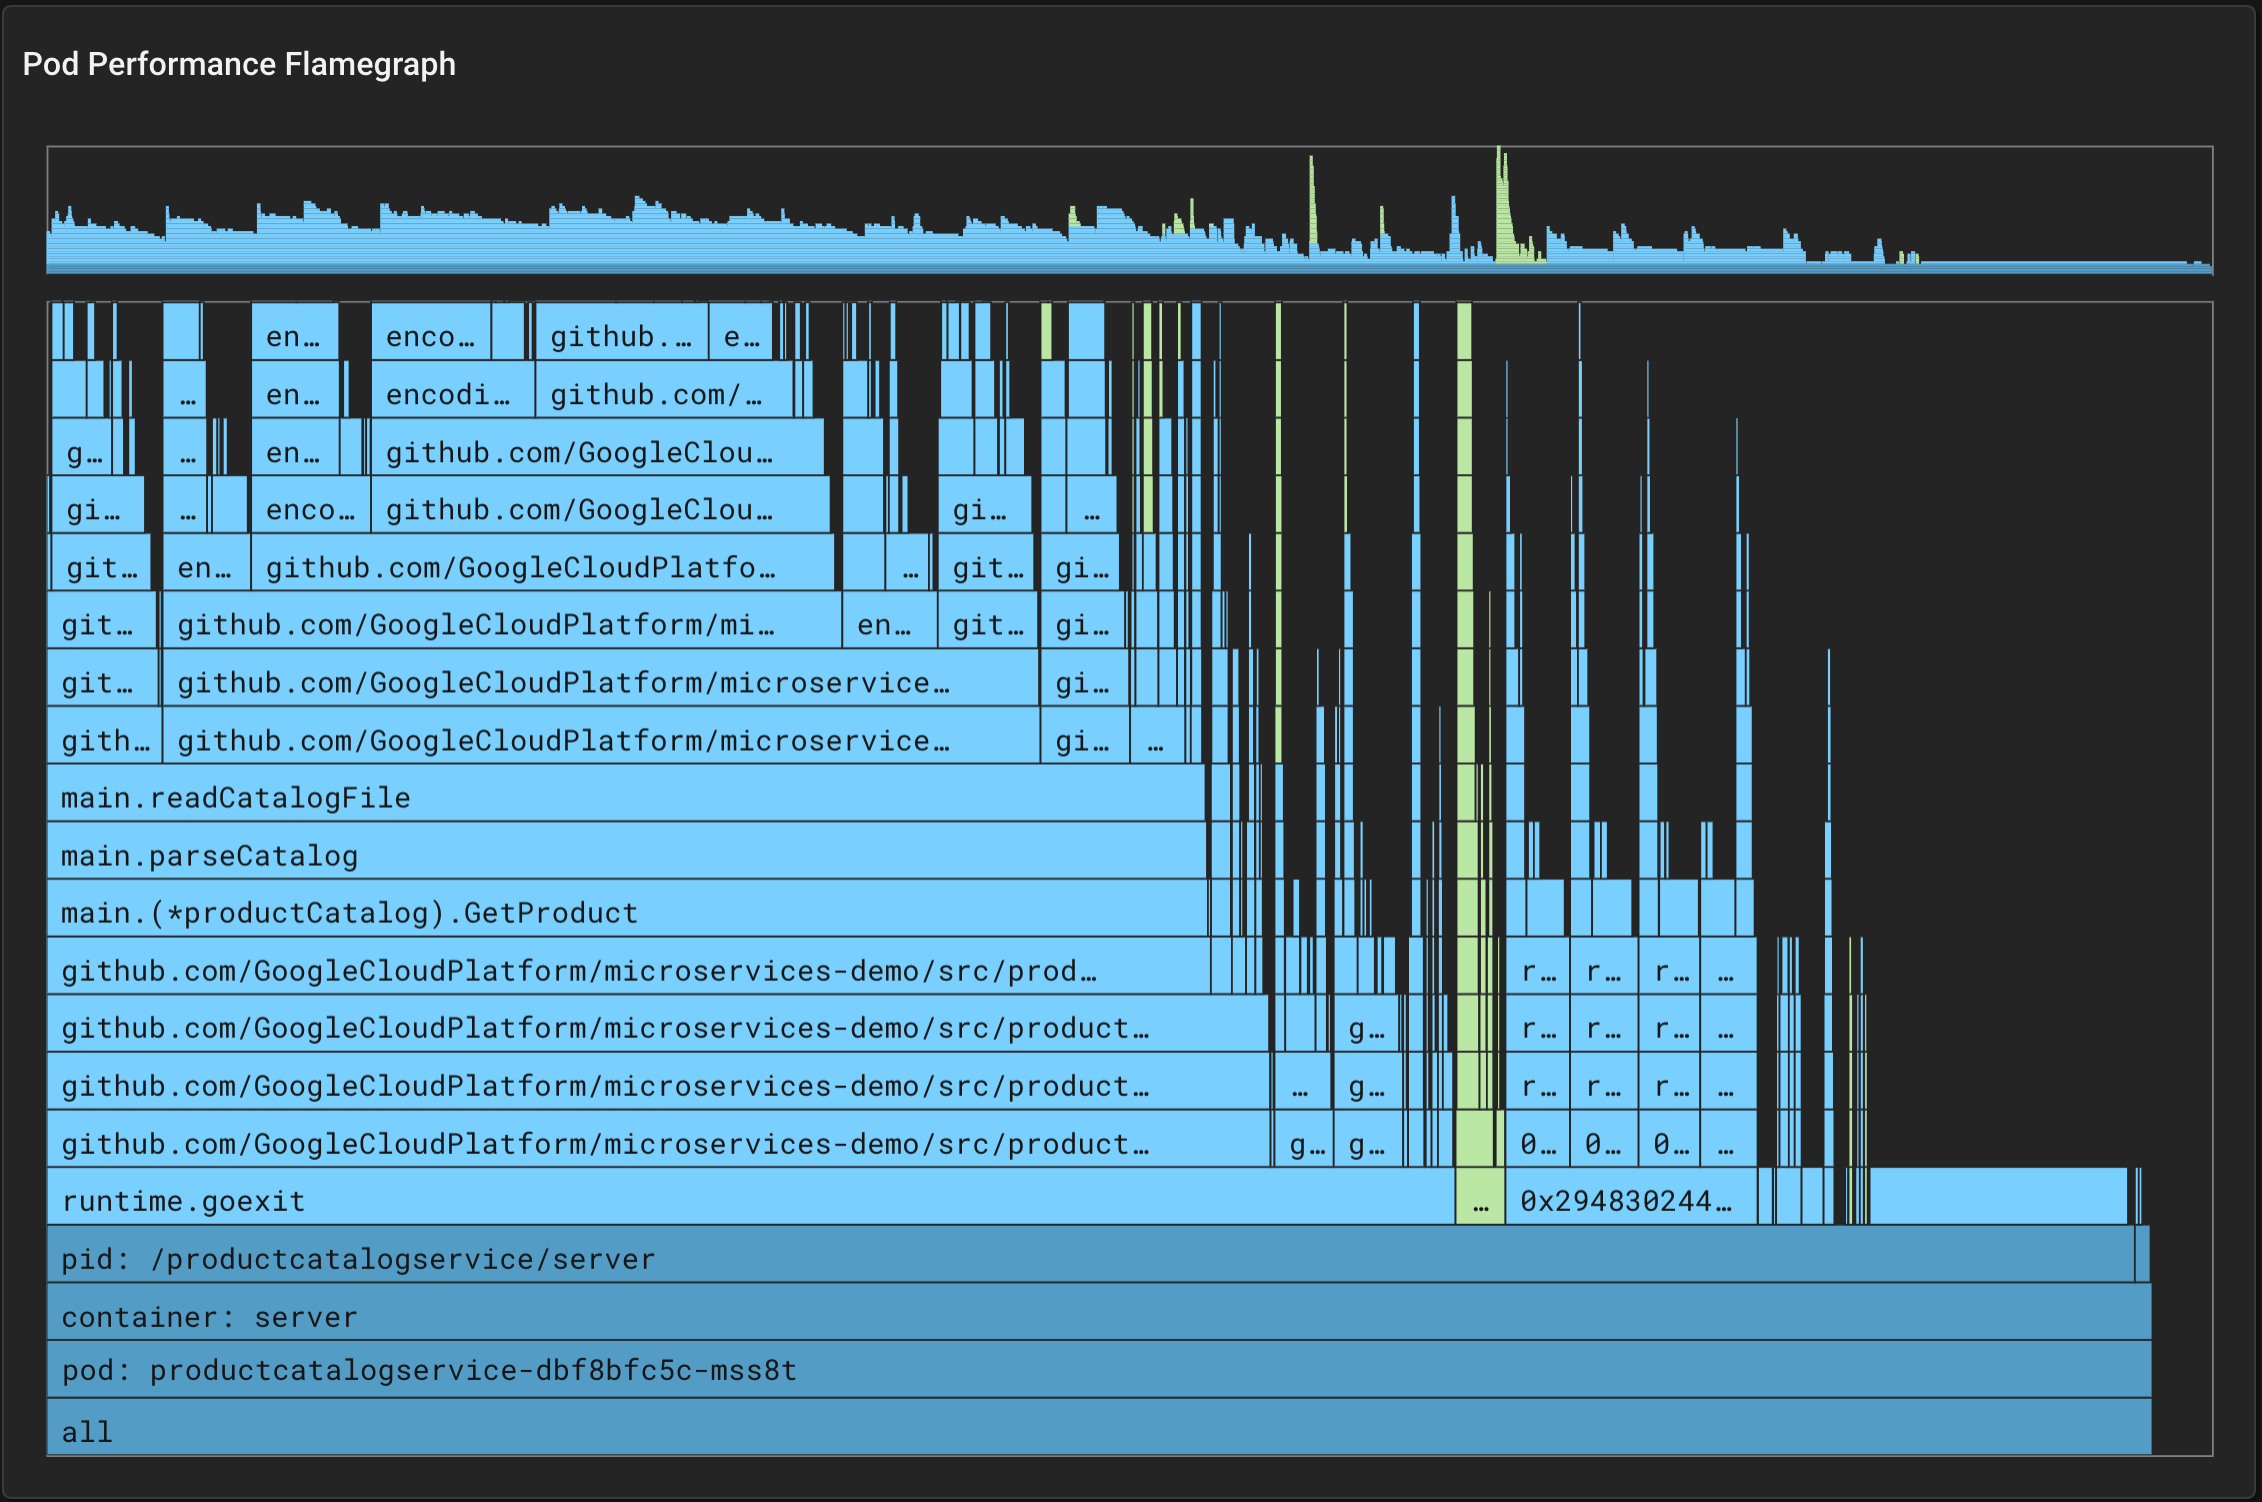
Here’s an example of a flame graph for a demo application:
In such a graph, we start looking for the frame that is wider on the x-axis (time-intensive) and high enough on the y-axis (nested); in particular, the parseCatalog() function is a “hot candidate” method to perform code analysis to investigate underlying performance issues, if any exist.
Runtime Environment Performance Metrics and Analysis
Before profiling an application, you need to understand the runtime environment in which it operates by collecting key performance metrics. Some of the basic metrics to look out for include:
- CPU utilization
- Memory usage
- API request latency
- Throughput
- Error rate
Monitoring and analyzing these metrics is important when profiling an application because any fluctuation or poor metrics will trigger the need to profile your code. Also, you can use them, along with profiling data, to view an application’s historical performance.
Tracking Performance Impacts and Trends with Flame Graphs
It is important to profile your application and measure its performance before you start changing any code. It is also crucial to save your historical flame graphs and use them to compare the impact of an application’s code changes; this way, you can track which hot code paths are eliminated or still exist before and after code changes.
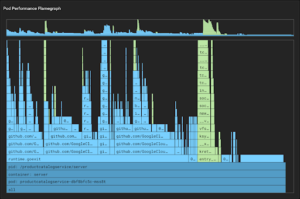
For example, in the following flame graph, you can notice the elimination of the CPU usage of the parseCatalog() function and its ancestor after fixing a code bug by comparing it to Figure 2.
Performance Improvements and Cost Reductions: What’s the Correlation?
Fixing performance bugs always leads to infrastructure cost reductions. For instance, finding the CPU time-intensive functions and introducing improvements leads to a reduction in CPU utilization, which in turn cuts the size of your application’s cluster (servers). This can also deliver higher throughput without the need for extra hardware or cloud resources, such as server instances.
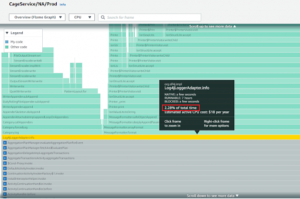
Let’s look at a real-world example of how performance improvements enabled developers to reduce infrastructure costs. By using the codeGuru profiler, the CAGE (an internal Amazon retail service that provides royalty aggregation for digital products) team found different reasons for performance bottlenecks and higher resource utilization, namely:
- High CPU time in garbage collection
- Excessive logging of CPU usage, as shown in the following flame graph:
- DynamoDB metadata cache overhead
By fixing these issues, the team improved service latency and reduced infrastructure costs by 25%. For more details on this use case, check out this AWS blog. Or, take a look at another example of how the load time of GTA was reduced by 70% using profiling techniques.
Introducing Continuous Profiling by Granulate
Our newly released profiling tool, incubated as an internal solution at Granulate, is open-source and simplifies the process of finding performance bottlenecks in your production environment with instant visibility. It can be deployed using a customized Docker container image to any environment. It continuously profiles your application code to the line level and pinpoints the most resource-consuming functions to help you optimize performance and reduce costs.
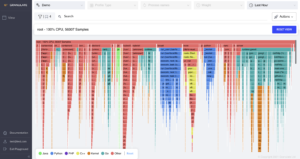
Continuous Profiling by Granulate (Source: Granulate)
What makes our profiler unique?
- Open-source: an open-source package for community use
- Plug and play installation: seamless installation without any code changes or efforts
- Immediate visibility: up and running in less than 5 minutes, facilitating immediate visibility to production code.
- Low overhead: minimal performance overhead, less than 1% utilization penalty
- Continuous: designed to be on continuously, facilitating effective analysis of performance issues in all environments, all the time
- Wide coverage: native support for Java, Go, PHP, Python, Scala, Clojure, and Kotlin applications; support for Node.js and Ruby coming soon
Code Profiling Next Steps
Application code profiling tools help you determine which code areas are consuming the most resources in production, which allows you to find ways to adjust the number of infrastructure resources by resolving performance bottlenecks. In addition, code profilers drive the engineering effort needed to fix the performance issues that actually matter in most cases.
Hopefully, this blog post helped you better understand what application profiling means and how to use profiling data to find opportunities for performance improvements and infrastructure cost reductions to boost the user experience ultimately.
To see how you can leverage code profiling to optimize your organization’s costs and performance, as well as boost your customers’ satisfaction, try Granulate’s free, open-source code profiler.